
WHAT ARE WE LEAVING ON THE TABLE?
New Research Review Identifies the Gilt Gap
It is well known that gilts just don’t perform as consistently as barrows. Since market pig production is made up of about 50% gilts, it's important to understand what causes the performance differences and what the gilt gap is really costing the industry. Dr. Ben Bohrer, meat scientist at The Ohio State University, and Dr. Jason Woodworth, nutritionist at Kansas State University, recently completed the most extensive research review to date quantifying the differences between barrows and gilts in growth performance, carcass composition, meat quality and the value of those differences economically.

Live Animal Performance
Growth Performance1
- Gilts compared to barrows:
- 5.9% lower ADG
- 11.4% lower ADFI
- 4.3% better feed efficiency
Final Body Weight1
- Gilts compared to barrows:
- 2.3% lower market weight
- Equivalent to 6.5 lbs lighter weight when barrows are marketed at 285 lbs
Final Body Weight Variability
- Data suggests higher gilt final weight variability compared to barrows, resulting in more light-weight discounted gilts
Sort Loss
- 1st cut: higher percentage of barrows are marketed
- Barn dump: higher percentage of gilts are marketed
- Example: 1000-hd barn split, with 10% final BW coefficient of variation:
On average, 10 more gilts weighing less than 230 lbs compared to barrows
Finisher Mortality
- Published data does not suggest differences in mortality between barrows and gilts, but a few papers report it
- Production staff often believe higher mortalities are observed with barrows
Estrus Development
- Selection for earlier maturing gilts in the breeding herd creates the possibility for development of estrus in market gilts
- If gilts begin to cycle, their ovaries and uterus are 5.5 and 13.9 times heavier than non-cycling gilts, which will be associated with less nutrients available for growth and lean deposition2
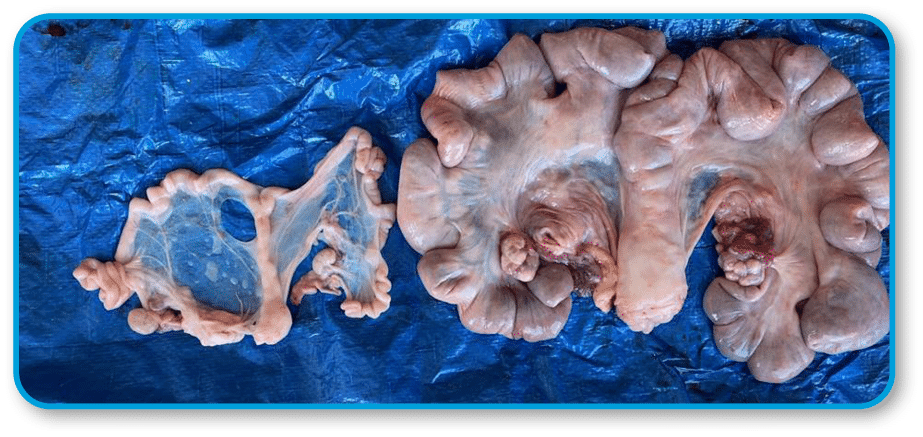
Comparison illustrating female reproductive tract of market weight gilts, pre-pubertal (left) and cycling (right)
Final report: TI-06444 (project 20PRGIMV-01-04)
Carcass Composition and Meat Quality
Hot Carcass Weight
- Driven by final body weight differences
- No differences in carcass dressing yield observed between barrows and gilts
- When carcass dressing yield = 75%, gilts have 4.8 lbs lighter hot carcass weight1
Carcass Composition1
- Gilts compared to barrows:
- 11.7% less backfat
- 4.5% greater percent lean
Primal Weight And Yield
- Reflective of differences in hot carcass weight
- Data does not suggest differences between barrows and gilts at same hot carcass weight
Marbling (intramuscular fat)
- Key indicator for premium-priced export markets
- Higher marbling is preferred
- Gilts compared to barrows:
- 15.2% less marbling1
Iodine Value (IV)
- IV is a measure of fat quality
- Higher IV = softer fat and poorer bacon slicing yield
- Key indicator for premium-priced export markets
- Lower IV is preferred
- Gilts compared to barrows:
- 2-3 units higher IV1
Color
- No meaningful differences in loin and ham color have been reported
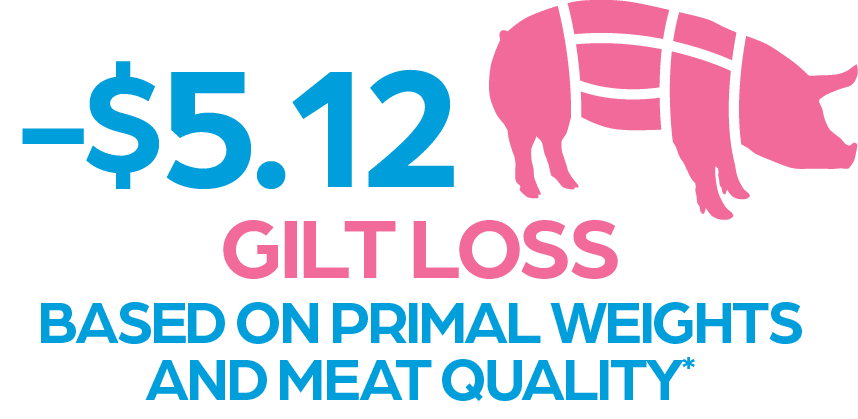
Economic Implications
PRODUCER ECONOMICS

INTEGRATOR ECONOMICS
Related Materials


Email to Learn More
1Woodworth, J., et al. (2021). Characterizing the differences between barrow and gilt growth performance, carcass composition, and meat quality. KSU Applied Swine Nutrition Department.
2Rodrigues et al. 2018. Animal, pp.1-6.
*Assuming market price = $75/cwt, gilts HCW = -2.2%, premium price = +15% over base price.
All trademarks are the property of Zoetis Services LLC or a related company or a licensor.
© 2022 Zoetis Services LLC. All rights reserved.
IMP-00125